Outlaw’s Stock Tutorial
Our program Members page updates daily during trading hours
Take a look at our home page it displays a photo of 4 scanners we provide to members
Type in your stock in Members page to display a Future summary of your stock.
Money Maker page will display 15 columns with stocks direction in 5, 15, 30, 60 min, 1 hour, 4 hour, Daily, Weekly and Monthly intervals
OLS Scanner page will display 14 columns with stocks direction in 4 hour interval
WLS Scanner page our members can input up to 10 stocks at one time to display 18 columns with stocks direction
Now Trending on members page, shows top 10 stocks that our members are tracking
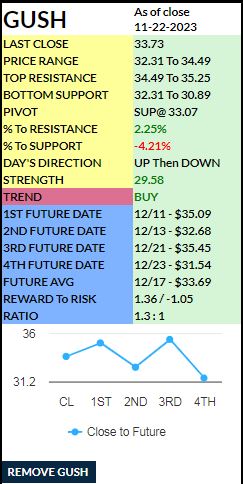
The member table contains 17 fields; on the left are the labels (in yellow, purple and blue), and on the right is the data (in green).
The yellow fields are for the next day’s information.
LAST CLOSE = Yesterday’s closing price.
PRICE RANGE = The next day’s price range.
TOP RESISTANCE = The high price ranges for the day. Our 1st. number is 1st resistance and our 2nd number is 2nd resistance
BOTTOM SUPPORT = The low price ranges for the day. Our 1st number is 1st support and our 2nd number is 2nd support
PIVOT = Middle of the day Res@/Sup@
(Res@) The close price is below the pivot price and pivot price becomes resistance.
(Sup@) The close price is above the pivot price and pivot price becomes the next support.
(Res@) With a * star symbol after the price = The close price is lower than the future date prices.
%To RESISTANCE: The percentage from the last close price to the top of the channel.
%To SUPPORT: The percentage from the last close price to the bottom of the channel.
DAY’S DIRECTION: Program predicts the direction of the movement from open to close.
STRENGTH: The strength shows overbought and oversold signals on a scale from 0 to 100. When strength is below 30, it is an oversold signal and the price is heading up soon. When strength is above 70, it is an overbought signal and the price should head down soon.
TREND: The purple field = The direction the trend has been moving in the past. This field will show one of these values.
- BUY = Our program has confirmed the trend has turned in an upward direction. Only enter stock when Trend shows Buy and Strength is under 30
- SELL = Our program has confirmed the trend has turned in a downward direction. Only exit or short stock when Trend shows Sell and Strength is over 70
- Neutral Up = The trend has been in an upward movement. Warning – possible to turn downward soon.
- Neutral Dn = The trend has been in a downward movement. Warning – possible to turn upward soon.
Examples = BUY confirms stock is near the bottom and is turning up. Wait for stock to hit our bottom support before entering and Strength shows under 30.
SELL confirms stock is near the top and is turning downward. Wait for stock to hit TOP RESISTANCE range before selling.
The blue fields represent data that is forecasting the predicted stock movement.
The 1st, 2nd, 3rd and 4th Future Date fields are forecasting the price the stock could hit before the given date.
FUTURE AVG: Averaging the 1st through the 4th Future Dates and prices.
REWARD TO RISK: Calculates the profit to loss margin.
RATIO: Calculates reward vs. risk for that stock.
The chart at the bottom of table shows predictions from the last closing price to the 1st, 2nd, 3rd and 4th date’s stock price movements.
Always refer back to our tutorial.
Three Simple Trading Rules to Follow
1. Know your Entry Price.
2. Know your Exit Price.
3. Know your Stop Loss Price.
Stick to these three rules. Don’t get greedy
How to use our program.
First, go to the member tab and enter a value into the Stock Symbol field and hit GET STOCK. NOTE: You can enter multiple stock tables in your member section.
When your stock table appears, look at the TREND (Purple) Row in the center of the table. It will show a value of BUY, NEUTRAL Up, NEUTRAL Dn or SELL.
If you see BUY in the TREND row, look at the STRENGTH value. If it is under 30, and if the strength number color has turned GREEN, then wait until the stock price comes down to the BOTTOM SUPPORT range before entering into a position.
If a stock goes below entry point at open then go look at our BOTTOM SUPPORTS and our FUTURE DATE PRICES on our website in members page to see how low it shows that stock can go.
The TOP RESISTANCE will show your exit price range.
Take your profit at the lower/middle end of the TOP RESISTANCE range. If you always try for the top of the range, you may fail to close your position. Take a profit and get out!
When the TREND field shows SELL and STRENGTH is over 70, most of the time the stock will run up to the TOP RESISTANCE range.
Before it starts dropping, look at the BOTTOM SUPPORT prices to know how low it will drop before entering into a position again.
When the TREND shows NEUTRAL Dn, check table daily until you see a BUY. At this point the downtrend is over and it is time to enter a position.
When the TREND field shows NEUTRAL Up, watch for it to change to a SELL. Since the trend has been going up it should pull back soon.
Always do your own research. Happy trading and good luck.
Special thanks to Beginner
An example of a Member page EOD summary sheet